www.ICDGroup.biz
Newark, Delaware
302.368.0538

Performance Doctor IO View

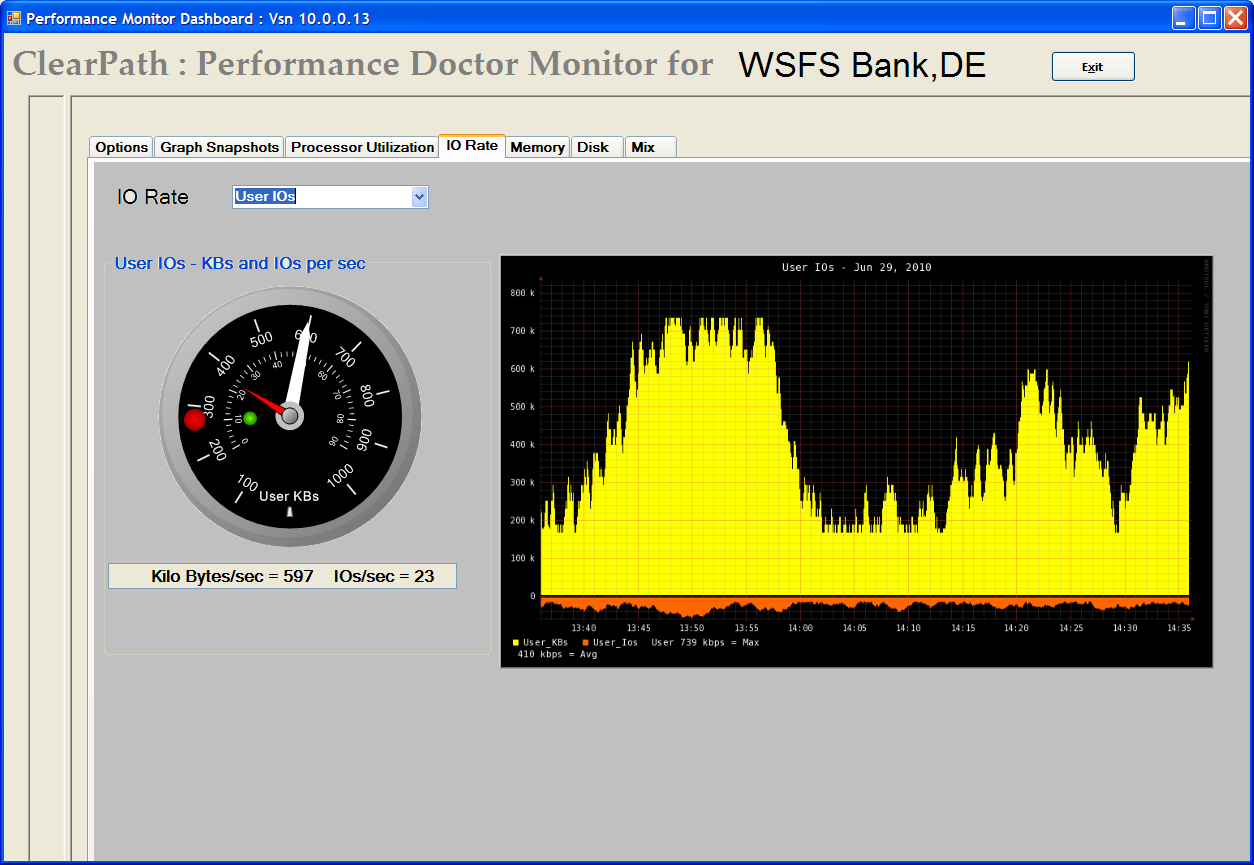
The IO Screen presents information in three areas of the screen :

  • The gauge displays real-time IO information. There are four types of IO statistic you can choose to display: User IO, MCP IO, Datacomm IO or IO interrupts.
  • The IO Usage history graph shows up to 24 hours of IO usage for your machine. (A smaller version of this graph is on the Snapshot screen.)
  • The Text box contains Mix information for a particular point on the history graph.

As you mouse over the graph a pop-up window displays information about the top active tasks that correspond to these points on the history graph.

With a mouse click Performance Doctor copies the list to the Windows clipboard and also into the text box.

Any time you see an area of interest on the graph you can capture the information about the associated active tasks with just a mouse click.