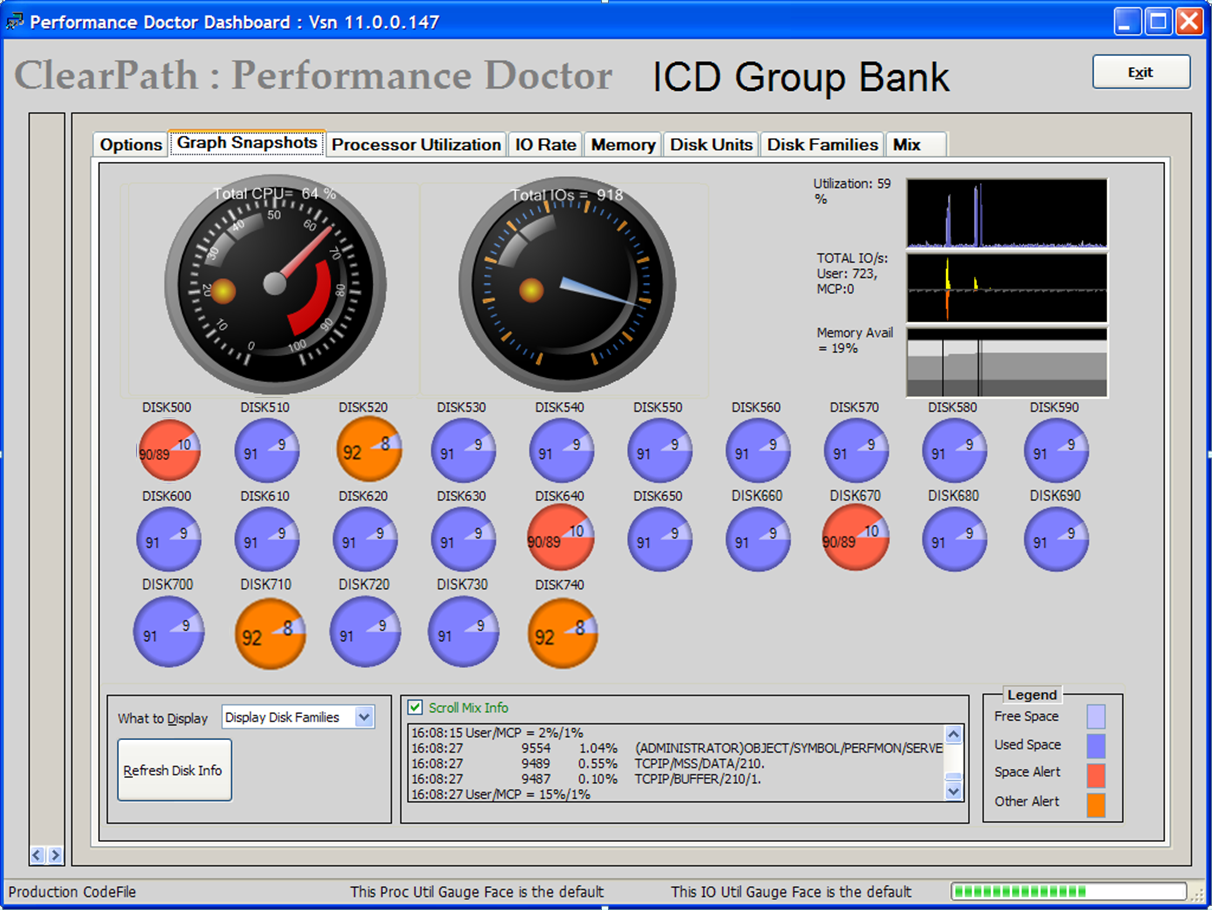
The Snapshot screen displays summary information: Disk Family use, most active Mix entries, Processor utilization, IO activity and Memory use.
Performance Doctor shows more detail about each of these on other screens.
Performance Doctor divides the Snapshot screen into three areas:
- Gauges and graphs in the top section show real-time and historical PROCESSOR, IO and MEMORY usage.
- Pie charts in the middle section show available disk space and popup windows that display any disk alerts.
- Performance Doctor uses color coding of these pie charts to indicate alert conditions. Mousing over a disk will display a pop-up window showing a description of any associated alerts.
- The Text box in the bottom section contains a real-time display of the most active CPU tasks. This information is logged for your later review.